SEO Guides, Tips & More!
Learn from Our Experience
Which Reports Matter in Google Analytics?
Data-driven marketing is a term that’s almost too ubiquitous. As painfully obvious as it is, the key to seizing short-term opportunities and long-term success lies in the data.
And where’s the data? For websites, it’s in Google Analytics.
Google Analytics is a widely used but also vastly underutilized tool in a marketer’s toolbox. Most marketers get the top-level descriptions of visitors, bounce rate, acquisition, and user behavior. But to get the most out of it, to really harness the power of Google Analytics to improve a website, marketers need to understand reports.
Given the plethora of data within Google Analytics, it’s easy to get lost. To get the best sense of website performance and clearly understand which content needs to be tweaked (and why), it’s best to focus on a handful of reports.
But First, a Note About the 2020 Google Analytics Upgrade
Like other Google properties, Analytics frequently undergoes updates and upgrades. To help marketers get better ROI from their website data, in late 2020 the team at Google unveiled some fairly significant changes.
“Analytics 4.0” rolled out with AI-fueled data, a streamlined reporting view, and combining website and app analytics into one dashboard. Marketers have had the option to revert back to what’s called a Universal Analytics property, but it’s best to use the new reporting mechanism going forward to get the best data.
What’s cool here is that Google Analytics 4 has the ability to help predict user behavior. It can do this through machine learning and predictive analytics. Marketers can get a pretty good idea of the content and calls to action that will be popular with certain user segments. This is huge. Web analytics can be responsible for driving future marketing decisions, not just reacting to the content that’s already out there.
Basically, the new platform tracks and measures events, not just pageviews. This is good news for websites that have more than just static pages. Elements like videos, downloads, site searches, and even scrolling to the content below the fold can be more accurately measured.
And second, reports are more streamlined into one place. This is also good news for marketers who are managing not just a website but a total online presence: ads, paid SEO, a mobile site, and even apps. There’s also more room to create custom reports, which is helpful but also overwhelming to many.
As of now, it’s not required to switch Google Analytics properties from Universal to 4.0. But there are a lot of reasons to do it.
Is Something Missing?
Professional services marketers already might not be getting the most out of Google Analytics. Even if the accountants and attorneys don’t understand it, the marketer needs to know what the opportunities are and how to respond. Google Analytics is a key piece of that puzzle.
Without Google Analytics, marketers are making decisions about content planning, budgets, and business development in a vacuum. Web analytics is always on. The data provides objective, accurate information about who’s interacting with the website, and which pages get the most attention.
Web visitors can be labeled and segmented into user groups based on which pages they visit, where they click from, and what kind of content they engage with. Especially for firms with integrated Google Ads and/or SEO, web visitors can be very neatly organized into segments and tracked to see which pages and content are getting the most hits.
This kind of data can be a huge value-add considering the time and resources that go into producing high-quality content. Marketers can objectively see which articles get the most hits, where form leads are coming from, which partner bio pages are trending higher, and use that information to target and tailor marketing and business development activities.
Now, when it comes to interpreting the data and presenting it to the partners, that’s where Google Analytics reports come in.
Top Google Analytics Reports for Actionable Data – Universal Analytics
Mining Google Analytics for insights and managing the website can easily be a full-time job. And that’s also part of the reason why many firms just don’t get as much out of the data as they could. It can help to narrow down which parts of Google Analytics provide the best information and leave the rest of the details alone – or to measure specific campaigns or outcomes.
These are the top reports in the traditional Google Analytics property, also known as Universal Analytics, that marketers should be checking regularly if they haven’t yet switched to 4.0.
Content Efficiency
What it is: A custom report to measure top-performing pages and those that might need a little work; ideal for websites with a lot of original content.
What it reveals: Which pieces of content are most engaging and what do site users value the most based on a few key SEO words and long-tail phrases.
How to interpret it: Once marketers download the report template, it can be used to discern whether the content that’s being published matters to site visitors. The report measures Entrances, Unique Visitors, Bounces, Pageviews, Average Time on Page, Per Visit Goal Value, and Total Goal Completions.
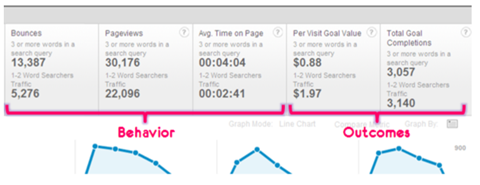
Image source: Avinash Kaushik
Mobile Overview
What it is: A report of mobile-only or mobile v. desktop website traffic
What it reveals: How well (or not) a website is optimized for mobile, which mobile browsers are used to access the site, and what content is popular for mobile users.
How to interpret it: Compare mobile results to desktop and even tablet sessions. See how mobile performance changes over time. Try to understand the user experience on mobile versus desktop. Use report results together with Google Search Console to monitor overall mobile site performance and areas for improvement.
Traffic Acquisition
What it is: A report of where users came from when they landed on the site, whether from other sites (referrals), direct, organic search, Google Ads, and social media.
What it reveals: How users find the website and what types of content they clicked on to get there.
How to interpret it: Depending on which digital or advertising strategy is being used, this report can inform marketers about what’s working to drive awareness to the website, specific pages, or specific goals. For example, a large billboard campaign would be expected to drive more direct traffic whereas an increased focus on social media would be expected to drive more traffic from LinkedIn or Facebook. Marketers should then look at user behavior to gather what’s keeping them on the site and if that varies according to the referral source. Compare time periods, bounce rate, and goal performance.
Keyword Analysis
What it is: A custom report that measures unencrypted keywords that users type in to find the website through organic search. (Download the report once logged into the website’s Google Analytics account.)
What it reveals: Incoming organic keyword analysis and the subsequent metrics that follow each keyword or phrase.
How to interpret it: Marketers should be looking at which search terms are being used to find their website in a typical Google search and if those are the keywords and phrases the site should be ranking for. The problem is, Google hides most of the search terms. With this custom report, marketers can pull back the curtain a bit to reveal unencrypted search terms, visitor metrics, conversion rates, goal completions, and page load times.
Bonus: Another custom report targeting “not provided” organic keywords is available for download here.
New vs. Returning Visitors
What it is: A report that is as it sounds: compares new and returning website visitors.
What it reveals: Whether the website can capture a fair amount of returning visitors, who tend to spend longer on the site. Basically, how effective the website is at enticing the same people to visit again.
How to interpret it: Usually at the beginning of a new digital campaign, it’s normal to have a much higher percentage of new website visitors and as a result, a higher overall bounce rate. Generally, firms should be looking for more returning visitors as time goes on and for those returning visitors to have a lower bounce rate, higher engagement, and produce higher value for the site.
Google Analytics now also provides a new v. returning visitor briefing on the Home page, which breaks down how many visitors returned from one month to the next.
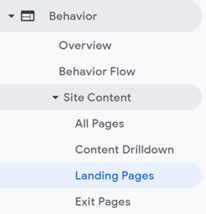
Landing Pages
What it is: A standard report that lists the top pages site visitors enter and exit on, available in two separate tabs.
What it reveals: The pages driving the most traffic to the site in a given period and the pages that visitors are most likely to leave on.
How to interpret it: There are two sides to this story: one, the most popular pages for a given period, and two, the pages that users deemed not worth clicking to another section of the site. The report can be used to discern what’s trending – and perhaps to create more content like that – as much as it’s used to see which pages might need to be optimized to better capture website visitors.
If the top exit pages usually trend the same, it’s a good idea to log into Google Search Console and test their page performance.
Bounce Rate vs. Exit Rate
What it is: A standard report that compares the difference between site visitors that leave after visiting only one page and visitors who look at more than one page before leaving.
What it reveals: This report can reveal user experience or technical issues with specific pages.
How to interpret it: Within this report, marketers can drill down to see which pages have the highest exit and bounce percentages; sometimes they’re the same, but not always. These are pages that require a closer look to ensure that certain page elements aren’t preventing better engagement: think poor design, page load times, distracting page elements, low-quality content, and so on.
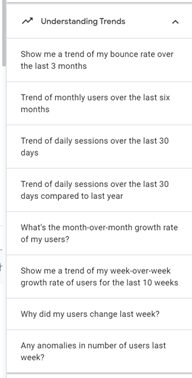
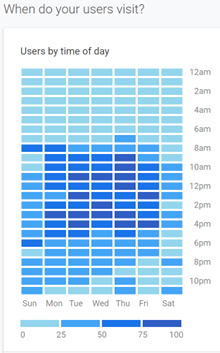
Google Analytics Home Page Insights
Google Analytics, even without the upgrade to 4.0, still provides robust data analysis and insights on the Home page. Take these prompts, for example. These are available without the need to create custom reports or spend a lot of time digging through tabs in the menu.
This snapshot of when users are most active on the site – again, available right from the Google Analytics Home page – tells marketers when the best time to publish new blog posts or site content depending on when people are most likely to see it.
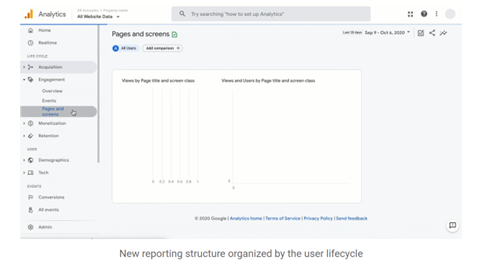
The new reports in Google Analytics 4 will look different from the ones described above and will be accessible in sligtly different ways. Look for these reports to be more visual (like the screenshots above) and already tailored for easy presentation to partners and other stakeholders. From Google’s Analytics support center:
Contact Us
The data within Google Analytics is invaluable. If you’re wondering how you’ll have time to run these reports and monitor the results regularly enough to make a difference, let alone make sense of them, give us a call.