SEO Guides, Tips & More!
Learn from Our Experience
Google Analytics 4
Update on Google Analytics 4
By now, marketers have probably noticed the option to switch from the historical view of Google Analytics to the Universal Analytics reports. Google Analytics 4, or GA4 for short, is the “next generation” of Google Analytics, as self-described by Google. GA4 can be used for a website, app, or both at the same time, giving marketers a new way to see how their online properties are performing and address SEO and other issues collectively, rather than piecemeal.
Why a New Google Analytics Property?
Google officially launched the fourth-generation analytics reporting in late 2020, so it’s no wonder that it may have gone relatively unnoticed until recently. GA4 response to the interconnectedness of online worlds: brands – yes, even in professional services – are using apps, advertising, and remarketing tools more than ever. With so many different channels coming into a website or app, it makes sense that the reporting mechanism needed to change.
Marketers reported that making better use of their analytics would be a top priority, and existing tools make it hard to see a complete picture of online performance. GA4 uses AI and machine learning to better spot trends in user activity and recommend targeted insights using predictive metrics. It’s also a better solution for marketers struggling to identify and segment web users when internet cookie restrictions make it harder to see site visitor demographics.
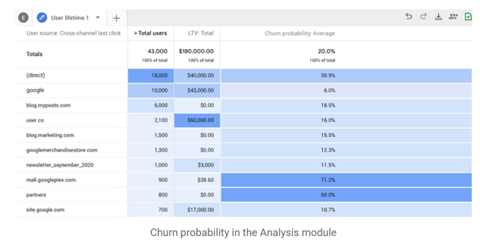
GA4, for example, can calculate churn probability, or the likelihood that a site visitor won’t return; in e-commerce, it’s the rate that customers cancel subscriptions or stop paying for services. In professional services, getting a better grasp of data like this could go a long way in adjusting content to better serve client needs and expectations.
The other nice thing about GA4 is that it integrates across Google marketing products and other channels – more communication between Google Ads, YouTube conversation rates, Google Search, social media, email, and non-Google paid channels is always a good thing.
From the Google Blog:
“The new Analytics gives you customer-centric measurement, instead of measurement fragmented by device or by platform. It uses multiple identity spaces, including marketer-provided User IDs and unique Google signals from users opted into ads personalization, to give you a more complete view of how your customers interact with your business. For example, you can see if customers first discover your business from an ad on the web, then later install your app and make purchases there.”
How to Set Up GA4
For existing sides already running Google Analytics, add a GA4 property using the GA4 Setup Assistant. This will collect data side-by-side, the existing Google Analytics doesn’t change, and the data can be migrated when marketers are ready to transition to GA4 for good.
GA4 is the default Analytics option for brand new sites, but marketers and web developers can still choose a side-by-side view if they’re not totally ready to switch to GA4 yet. As above, data can be migrated to the new property at a later time.
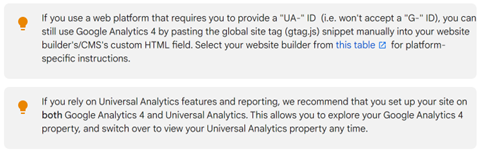
Some useful tips from Google Support:
Key Differences Between Universal Analytics and GA4
For one, the user interface and reports look different.
There’s no question as to which Google Analytics property is being viewed; GA4 loses the categories on the left side, replacing them with Life Cycle, User, Events, Explore, and Configure.
Reports are generated based on events; any interaction with the online property can be an event. This isn’t radically different on the surface; however, marketers in Universal Analytics are used to seeing events categorized and labeled. In GA4, every interaction, or web hit, is an event. Period.
In use, this makes sense and provides the marketer with more flexibility to track data sets that may actually matter.
There are four main event categories in GA4:
- Events that are automatically tracked and collected; there’s nothing the marketer or web developer needs to do.
- Events that are added or disabled based on web or app functionality, like scrolls, outbound clicks, site search, and video engagement.
- Events that Google recommends based on a general industry.
- Events that are customized using parameters according to the unique needs of a site, app, or both.
These parameters are defining characteristics to help track the data.
GA4 also removed the monthly limit on the number of web visitors it would track. Previously, the limit was 10 million. GA4’s limit, instead, is on a max of 500 different events that can be collected and tracked.
GA4 is also automatically connected to BigQuery, which allows marketers and others to run detailed and complex data reports on a large data set. This is a paid option with the existing Univeral Analytics property.
How to Use GA4 – A Primer
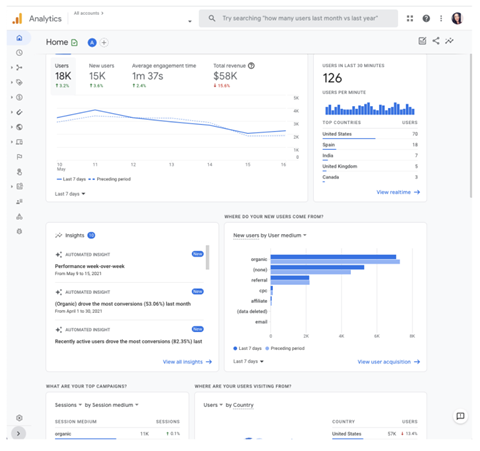
The main dashboard (below) will sum up overall traffic, conversions, and revenue for the web property. This isn’t a tell-all; rather, use this as a snapshot to quickly see where new users are coming from, which pages and screens get the most views, and if the firm is running a campaign, its performance.
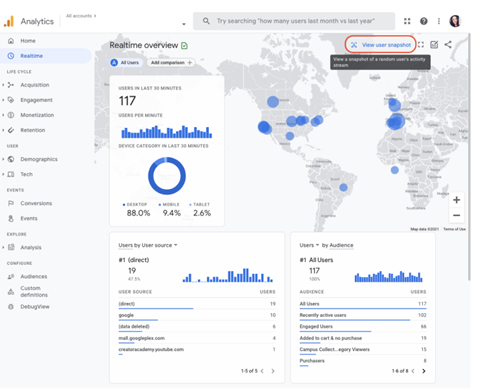
Real-time reports show the latest traffic from the past 30 minutes. This is helpful if an email just went out or a YouTube video just launched. The User Snapshot tool here allows marketers to see information about the user’s device, location, and site engagement – in real-time.
Life Cycle Reporting is another tool. It mimics the sales funnel and helps marketers better understand where site visitors are in the pipeline and how they got there.
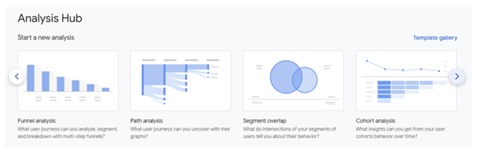
Then, the Analysis Hub allows marketers to choose a technique from which to analyze a data set. For example, there’s a funnel analysis, a path analysis, a segment overlap, cohort analysis, and many other templates. Actionable data that’s easy to understand? Check.
In more detail:
Funnel analysis visualizes the steps users take to complete an event; say, a form submission
Path analysis provides a tree graph to see user behavior triggered by events
Segment overlap looks at a specific user group – maybe based on geography, certain page visitors, or people who completed a specific action – and see where the overlap occurred in the events
Cohort analysis evaluates a group of users with a commonality, like they all completed the same event or all visited on the same day, to see how long it took them to complete a named event.
Shout out to Search Engine Journal for the GA4 screenshots shown here.
GA4 for Professional Services Firms
Google Analytics has always been a great source of objective data. Decisions about which content to focus on and how to improve landing pages already comes from Analytics reports. But there’s a lot more the new Analytics can do.
Given its focus on the customer rather than the site itself, GA4 can help marketing teams connect the dots for partners using actionable market research. Data from the new reports can better inform partners and service or industry leaders about emerging trends and more clearly identify user segments. Access to specific opportunities can bring the website even closer to a revenue-generating tool for firms that have struggled with this in the past.
GA4 will also help firms fill in the gaps of who visits their website. Its predictive analytics can step in and help marketers understand who’s visiting their site, even when cookies are disabled. In this way, it helps the firm conform to more stringent data privacy rules because the analytics can better predict user behaviors without the need to collect personally identifiable data.
More than that, GA4 links users across devices and platforms. That means reports that the firm might actually be able to use.
Flashpoint is already helping clients navigate the switch to GA4. Contact us for questions.